

Management’s Discussion and Analysis This Management’s Discussion and Analysis
(“MD&A”) of GLG Life Tech Corporation is dated November 14, 2018. It provides a review of the financial results for the three and nine months ended September 30, 2018, compared to the same periods in the prior year.
This MD&A relates to the consolidated financial condition and results of operations of GLG Life Tech Corporation (“we,” “us,” “our,” “GLG” or the “Company”) together with GLG’s subsidiaries in the People’s Republic of China (“China”) and other jurisdictions. As used herein, the word “Company” means, as the context requires, GLG and its subsidiaries. The common shares of GLG are listed on the Toronto Stock Exchange (the “Exchange”) under the symbol “GLG”. Except where otherwise indicated, all financial information reflected herein is expressed in Canadian dollars and determined on the basis of International Financial Reporting Standards (“IFRS”). This MD&A should be read in conjunction with the condensed interim consolidated financial statements and notes thereto for the nine months ended September 30, 2018, as well as the annual consolidated financial statements and notes thereto and the MD&A of GLG for the year ended December 31, 2017. Additional information relating to GLG Life Tech Corporation including GLG’s Annual Information Form can be found on GLG’s web site at www.glglifetech.com or on the SEDAR web site for Canadian regulatory filings at www.sedar.com.
Significant assumptions about the future and other sources of estimation uncertainty that management has made at the end of the reporting period, which could result in a material adjustment to the carrying amounts of assets and liabilities and disclosure of contingent assets or liabilities in the event that actual results differ from assumptions made, relate to, but are not limited to, the following: determining the accrued liabilities; assessing the fair value of property, plants and equipment, biological assets, intangible assets and goodwill; the valuation of future tax assets; revenue recognition; estimate of inventory net realizable value; going concern assumption; expected useful lives of assets subject to amortization and the assumptions used in determining the fair value of stock-based compensation. While management believes the estimates used are reasonable, actual results could differ from those estimates and could impact future results of operations and cash flows.
GLG has issued reports on certain non-IFRS measures that are used by management to evaluate the Company’s performance. Because non-IFRS measures do not have a standardized meaning, securities regulations require that non-IFRS measures be clearly defined and qualified, and reconciled with their nearest IFRS measure. Where non-IFRS measures are reported, GLG has provided the definition and reconciliation to their nearest IFRS measure in section “NON-IFRS Financial Measures”.
Forward-Looking Statements
Certain statements in this MD&A constitute “forward-looking statements” and “forward looking information” (collectively, “forward-looking statements”) within the meaning of applicable securities laws. Such forwardlooking statements include, without limitation, statements evaluating the market, statements regarding potential demand for stevia, monk fruit, and other products and discussions regarding general economic conditions and future-oriented costs and expenditures. Often, but not always, forward-looking statements can be identified by the use of words such as “plans”, “expects” or “does not expect”, “is expected”, “budget”, “scheduled”, “estimates”, “forecasts”, “intends”, “anticipates” or “does not anticipate”, or “believes” or variations of such words and phrases or words and phrases that state or indicate that certain actions, events or results “may”, “could”, “would”, “might” or “will” be taken, occur or be achieved.
While the Company has based these forward-looking statements on its current expectations about future events, the statements are not guarantees of the Company’s future performance and are subject to risks, uncertainties, assumptions and other factors which could cause actual results to differ materially from future results expressed or implied by such forward-looking statements. Such factors include amongst others the effects of general economic conditions, consumer demand for our products and new orders from our customers and distributors, changing foreign exchange rates and actions by government authorities, uncertainties associated with legal proceedings and negotiations, industry supply levels, competitive pricing pressures and misjudgments in the course of preparing forward-looking statements. Specific reference is made to the risks described herein under the heading “Risks Related to the Company’s Business” and “Risks Associated with Doing Business in the People’s Republic of China” for a discussion of these and other sources of factors underlying forward-looking statements and to those additional risks set forth under the heading “Risk Factors” in the Company’s Annual Information Form for the financial year ended December 31, 2017. In light of these factors, the forward-looking events discussed in this MD&A might not occur.
Further, although the Company has attempted to identify factors that could cause actual actions, events or results to differ materially from those described in forward-looking statements, there may be other factors that cause actions, events or results not to be as anticipated, estimated or intended. The Company undertakes no obligation to publicly update or revise any forward-looking statements, whether as a result of new information, future events or otherwise, except as required by law.
As there can be no assurance that forward-looking statements will prove to be accurate, as actual results and future events could differ materially from those anticipated in such statements, readers should not place undue reliance on forward-looking statements.
Financial outlook information contained in this MD&A about prospective results of operations, capital expenditures or financial positions is based on assumptions about future events, including economic conditions and proposed courses of action, based on management’s assessment of the relevant information as of the date hereof. Such financial outlook information should not be used for purposes other than those for which it is disclosed herein.
Overview
We are a leading producer of high-quality stevia extract and high-quality monk fruit extract. While stevia has long been the foundation of our company, over the last three years we have been producing and selling monk fruit extracts to the international market. Stevia extracts, such as Rebaudioside A (or Reb A), and monk fruit extracts are used as all-natural, zero-calorie sweeteners in food and beverages. Our revenue presently derives primarily from the sale of high-grade stevia extract to the food and beverage industry; the expansion into monk fruit extracts represents an additional significant source of actual and potential revenues. Furthermore, we have expanded our product offerings and market opportunities through the supply of ingredients complementary to the natural high-intensity sweetener market under our Naturals+ product line. We conduct our stevia and monk fruit development, refining, processing and manufacturing operations through two wholly-owned subsidiaries in China. Our stevia operations in China include four processing factories, stevia growing areas across 10 growing regions, and four research and development centers engaged in the development of high-yielding stevia seeds and seedlings. Our processing facilities have a combined annual throughput of 41,000 metric tons of stevia leaf, over 1,500 metric tons of high-purity stevia extract, and 130 metric tons of high-purity monk fruit extract.
Corporate and Sales Developments
GLG Announces Entry Into Cannabis (CBD) Market And Signed Acquisition Agreement with Leading Chinese CBD Partner
On September 4, 2018, the Company announced plans to enter the international cannabis market, with a primary focus on high-purity cannabidiol (CBD) products for sale into the international marketplace. The Company has entered into a strategic framework agreement to acquire the majority ownership of a leading Chinese hemp cultivator and producer of high-purity CBD oils and products.
GLG’s decision to enter the cannabis space and particularly the CBD (cannabidiol) space aligns well with the Company’s historical business focus, industry-leading expertise, and core competencies. Like stevia, the cannabis industry is fundamentally an agricultural industry, one in which a company’s success often hinges on its ability to develop superior plant varietals and growing techniques, as well as the ability to economically isolate and highly purify the key components within the plant (e.g., cannabidiol or CBD) while applying stringent quality standards. GLG is an industry expert in these crucial skills within the stevia sphere; these skills will be valuable assets in its cannabis-based business. To advance its position in this industry, the Company has engaged in this strategic framework agreement to exclusively negotiate a majority ownership position with a leading Chinese hemp cultivator and planned producer of high-purity CBD oils and related products. The joint enterprise will be a B2B wholesale extraction business, including the production, marketing and selling of these CBD oils and products on a wholesale basis, focused initially on the Canadian and European markets.
This signed non-binding acquisition agreement between GLG and its Chinese counterpart will, contingent on performance of certain terms, including a registered capital contribution by GLG, provide GLG with a 55% controlling interest in this Chinese CBD company as well as control of the Board. As part of the agreement, GLG will also provide engineering design and consultation for the planned CBD extraction facility. All funds invested by GLG are to be used solely for facility construction and company development. The final agreement will be subject to due diligence, any necessary regulatory and governmental approvals, as well as GLG Board approval, and will be contingent on GLG securing the necessary funding for the acquisition.
The Company’s partner, Yunnan Guyimei Company (“Guyimei”), is the exclusive supplier of hemp agriculture in China’s Yunnan province, with a proven record of cultivating hemp varieties containing high levels of CBD. Guyimei is in the process of completing a CBD extraction facility within 2018 and, significantly, has a valuable and coveted license to export cannabis products. The initial capacity of this facility will be 1,000 kilograms (kg) of high-purity CBD oil and can be easily expanded as required to produce multiple metric tons (MT) per year. Guyimei’s existing agriculture license allows them to grow approximately 3,000 MT of hemp leaf on approximately 2,500 acres of land. This leaf would generate approximately 15-20,000 kg of high-purity CBD oil. The two companies – Guyimei and GLG – complement each other well. Guyimei’s export licensure, its exclusive grower status and premium varietals, and its agricultural and anticipated production capacity make it a compelling partner for GLG for the production and export of CBD products. Conversely, GLG’s proven extraction and production expertise, its international QA practices and standards, and sales experience in the international marketplace, make GLG a compelling partner for Guyimei. GLG is already leveraging its innovative expertise in the areas of CBD extraction and improved hemp varietals, having arranged for the filing of four key CBD patents through its Chairman and CEO, Dr. Luke Zhang. GLG, like its international customers, considers quality to be paramount and reflects this mindset throughout its policies and production facilities, which adhere to exacting international standards and carry a full complement of international certifications covering good manufacturing (GMP) practices, diet-sensitive (e.g., Kosher/Halal) designations and safety concerns. And GLG, with its long experience in the international stevia business, knows what it takes to sell into international markets and to establish major supply agreements with national and global companies.
Importantly, GLG anticipates that the CBD oils produced in China by this partnership will have significantly lower costs compared to CBD oils produced in North America while still maintaining the highest levels of quality. GLG expects that this cost differential will be a long-term major advantage as this CBD endeavor establishes itself in the Canadian and international cannabis marketplace. Thus, together, the two companies anticipate bringing a supply of low-cost, high-quality CBD oils and related products into the international cannabis market. While many companies in the burgeoning cannabis markets have focused on the recreational users of marijuana – those products integrate the psychoactive component of cannabis (THC) – CBD, the other primary cannabis oil, continues to be a major market segment. Notably, CBD has many healthful applications, including pain relief, sleep regulation, appetite stimulation, and digestive benefits. Indicative of its beneficial nature, CBD has a long history of use in traditional Chinese medicine as an important supplement. Like the rest of the cannabis market, the CBD segment is also growing rapidly: according to a new report from New Frontier Data, after observing that in the US alone, the CBD industry grew by nearly 40% in 2017, the report projects that the CBD industry is on track to grow to $2 billion by 2022. Dr. Luke Zhang stated: “The cannabis/CBD market is expected to create significant value for GLG’s shareholders in addition to our stevia operations. We plan to run these businesses separately; however, we will leverage our extraction, agriculture and QA expertise in our CBD business. As a graduate from Vanderbilt University with a Ph.D. in Pharmacology, I truly appreciate the healthful nature of CBD products and the medical benefits that they bring. It is a natural fit for GLG, with its long history of producing and innovating with zero-calorie plant-based sweeteners as sugar replacements – healthful products are the core of its business. And GLG knows how to leverage its strengths and advantages as a Canadian-Chinese company into producing high-quality, well-priced products that are second to none.”
GLG Announces Completion of Core Bank Debt Consolidation
On September 25, 2018, the Company announced that its primary Chinese debtholder, China Cinda Assets Management Corporation Anhui Branch (“Cinda”), has completed its buyout of the Company’s core bank debt. Page 6 of 31 Cinda now holds 100% of the Company’s core bank debt, held at GLG’s China subsidiary Anhui Runhai Biotechnology Joint Stock Company, Ltd. (“Runhai”). Consolidation of the Company’s China core bank debt under one lender was a major milestone prior to conversion of that debt into an equity stake in Runhai. The final piece of the core bank debt buyout comprised nearly RMB 80 million, or nearly CAD $15 million, in debt principal that the Company previously owed to Bank of Communications. With Cinda’s acquisition of this debt holding from Bank of Communications, Cinda’s total principal debt holding increased to approximately RMB 322 million or CAD $61 million. With Cinda’s core debt acquisition complete, GLG looks forward to continuing its work with Cinda on completing the restructuring project and having Cinda becoming a shareholder in Runhai.
Dr. Luke Zhang, CEO and Chairman of GLG, commented: “We are very pleased to see Cinda Anhui complete its buyout of the last remaining core Chinese debt holder in anticipation of realizing our Phase II Debt Restructuring goals. With Cinda’s core debt acquisition complete, GLG looks forward to continuing its work with Cinda on bringing the restructuring project to completion and having Cinda become a shareholder in our Runhai joint stock company. Once the Phase II Debt Restructuring Project is complete our consolidated balance sheet will be greatly improved with the conversion of over $60 million debt into equity in Runhai. We also will be bringing on a new shareholder that shares our vision for growth in our continued pursuit of becoming a leading natural zero calorie sweetener producer globally.”
GLG Announces Major Milestone in Its Debt Restructuring Progress
On July 23, 2018, the Company announced that it had reached a pivotal milestone in its efforts to restructure the Company’s Chinese-held debt. In its announcement, the Company provided an update to its February 2018 news release, in which the Company announced that it had received an official letter from China Cinda Assets Management Corporation Anhui Branch (“Cinda”) confirming Cinda’s intention to move forward in 2018 as a new shareholder in GLG’s new joint stock company – Anhui Runhai Biotechnology Joint Stock Company, Ltd. (“Runhai”) – and to resolve the Company’s Chinese bank debt obligations. Earlier in July, the Company’s two largest Chinese debtholders – Cinda and China Hua Rong Assets Management Shandong Branch (“Hua Rong”) – executed an agreement for the cash purchase of approximately RMB 231 million in principal and interest, or approximately CAD $45 million, with respect to the Company’s Chinese bank debt held by one of its Chinese subsidiaries. Under the terms of the agreement, this amount is now payable by the Company, through its Chinese subsidiary, to Cinda instead of Hua Rong. The Company will retain an approximately RMB 18 million or CAD $3.6 million interest liability payable to Hua Rong through that subsidiary. This is a very significant event towards completion of the debt restructuring plans as discussed in the Company’s 2017 Management Proxy Circular. As a result, Cinda becomes the majority debtholder of GLG’s outstanding China bank debt, increasing its debt holding from 24% up to 74% of GLG’s outstanding China bank debt principal. Further, Cinda is actively negotiating for the buyout of the Company’s remaining Chinese bank debt and expects to complete that buyout in the near future. By making this significant move to consolidate the Company’s Chinese bank debts, Cinda is well on the path to converting the bank debt it holds into a shareholding in Runhai. Cinda’s addition of approximately CAD $35.8 million in debt principal rights (along with approximately CAD $9.6 million in interest rights) substantially increases its total debt principal holding to CAD $47.6 million or an increase of over 300%. Cinda’s cash purchase of Hua Rong’s debt holdings in the Company’s subsidiary, along with its plans to acquire all remaining Chinese bank debt before converting the full debt position into equity and becoming a shareholder in Runhai, reflects its belief in the Company’s ability to become profitable, to continue acquiring market share through innovation and global sales efforts, and to continue improving the Company’s position as a leading global zero-calorie, natural sweetener producer.
Dr. Luke Zhang, CEO and Chairman of GLG, commented: “We are very pleased to have Cinda Anhui take this major debt position in anticipation of realizing our Phase II Debt Restructuring goals. We will continue to work closely with Cinda as they complete their debt acquisition and finalize plans for conversion of the debts into equity in our Runhai joint stock company. With the debts removed from our balance sheet and Cinda as a shareholder, we expect to be in an excellent position to take the Company to the next level in our pursuit of becoming the leading stevia and natural sweetener producer globally. After more than two years of intense efforts to fundamentally restructure our debts, rebuild our balance sheet, and acquire new shareholders that share our vision for growth, we are finally on the verge of completing this ambitious restructuring project.”
GLG Announces Update on Phase Two Debt Restructure Progress
On February 27, 2018, the Company announced an update on the second phase of its debt restructure initiative. GLG reported that it had received an official letter from China Cinda Assets Management Corporation Anhui Branch (“Cinda Anhui”) confirming their intention to move forward in 2018 as a new shareholder in GLG’s new joint stock company – Anhui Runhai Biotechnology Joint Stock Company, Ltd. (“Runhai”) and to resolve Runhai’s bank debt obligations. Cinda Anhui has taken the lead in consolidating GLG’s Chinese debt amongst the other Chinese banks and has been engaging in negotiations with the Company to convert all the outstanding bank debt into equity into Runhai. The letter highlighted Cinda Anhui’s involvement in the debt restructuring process, including its work with the other Chinese banks that have held debt in Runhai. Significantly, this letter also formally communicates Cinda Anhui’s intent to move forward in 2018 to resolve the Company’s Chinese debt positions. This update follows up on the Company’s November 2017 update, in which the Company announced that the negotiations are proceeding well for a draft agreement with all lenders. These efforts remain on track. As previously noted, the Company plans to provide all necessary public disclosure once the final plan is agreed by all parties including GLG’s Board of Directors. Dr. Luke Zhang, CEO and Chairman of GLG, commented: “We continue to make significant progress on our Phase II Debt Restructuring. This letter from Cinda Anhui confirms that our bank debt restructuring plans remain on track for completion in 2018. We will continue to work hard on behalf of the GLG shareholders to finalize the restructuring plan with Cinda Anhui, and in doing so, bring a strong financial partner to Runhai that will further strengthen our position in the market and fundamentally restructure our balance sheet by converting our bank loans into equity in Runhai.”
GLG and ADM Announce New High Reb M Product Line
On February 7, 2017, the Company, in collaboration with Archer Daniels Midland Company, announced the newest addition to its portfolio of great-tasting stevia extracts, the new high Reb M product line. Made from GLG’s proprietary high Reb M Dream Sweetener™ Stevia Leaf, this next generation stevia product line facilitates sugar replacement with better-tasting, low-calorie natural sweetening systems and solutions that provide a sugar-like sensory experience. “With more than sixteen years of experience in developing zero-calorie natural sweeteners, we always have consumer preference foremost in mind, and our new high Reb M product line squarely addresses the calorieand sugar-reduction goals of today’s food and beverage industry,” said Dr. Luke Zhang, CEO and Chairman of GLG. “These products provide a clean and full-bodied sweetness experience that is remarkably close to sugar, allowing for deeper calorie reduction through reduced sugar formulations. And with its sucrose-like sweetness, these high Reb M products enable formulators to reduce sugar more than ever before and provide the end consumer with better-tasting healthier choices.” Page 8 of 31 GLG’s high Reb M products are developed from a physical extraction process from GLG’s proprietary Dream Sweetener stevia leaves, which have exceptionally high quantities of those steviol glycosides (Reb M) that have a particularly sugar-like taste. High purity Reb M is two hundred to three hundred times sweeter than sucrose, giving it more upfront sweetness with reduced lingering and bitterness when compared to traditional stevia sweeteners. Other competing products in the market use chemical treatments or are produced using fermentation processes that employ non-natural, bio-engineered fermentation organisms and enzymes.
Furthermore, given that our high Reb M extracts are produced only from the leaf, our extracts can be used as sweeteners in jurisdictions such as Europe that otherwise do not permit such use of stevia extracts when produced using bioconversion or fermentation methods. Brian Meadows, President and CFO of GLG, commented: “Having this wide-ranging acceptance across key regulatory jurisdictions provides a significant advantage, not only for Europe-centric brands, but also for those global brands looking to distribute their products in all major global markets.” Whether used by itself or combined in a sweetener or flavor system, this high Reb M product line works well across all food and beverage applications without bitterness, astringent notes, or overly lingering sweetness previously associated with other stevia ingredients. It blends well with other natural sweeteners, such as monk fruit and sugar alcohols, to create balanced sweetness
And these products can be used as both single sweeteners in sparkling beverages or employed in blends with other natural sweeteners, such as erythritol, allulose, and agave syrup. Due to their enhanced mouthfeel properties they are a perfect choice for low and no-calorie beverage applications. Because there are no enzyme enrichment or fermentation techniques employed in the production of GLG’s Reb M product line, they are also clean label ingredients, an added benefit to formulators looking to meet the growing consumer demand for clean and clear labels and purposeful ingredients. “GLG’s high Reb M product line provides many different options for our customers who are seeking improved taste, greater calorie and added sugar reduction, and clean label solutions for their latest food and beverage innovations,” said Rod Schanefelt, director, ADM, GLG’s global sales and marketing partner. “Because GLG Dream Sweetener leaf is the direct source for these products, we can also offer customers an organic line of leaf-sourced high Reb M products through GLG, which gives formulators even more options. We are excited about the possibilities this new line of sweeteners opens for our customers.”
GLG Announces New Reb M Agricultural Patents
On June 28, 2018, the Company, announced an important update regarding three new patent filings for the development of Non-GMO high Rebaudioside M stevia plants. Recently, the global food and beverage market has seen increasing demand for next generation natural, clean label, low-calorie sweeteners for use in consumer products, driven by more health-conscious populations that seek to reduce sugar and replace it with low-calorie natural alternatives. The predominant industry focal point has been Rebaudioside M (Reb M) – a naturallyoccurring glycoside in the steviol glycoside family – which has the most sucrose-like flavor profile of all known glycosides; in terms of taste profile and sweetness, it is vastly superior to the stevia extracts (largely Rebaudioside A, or Reb A) generally found in the market today. In terms of economics of production, however, Rebaudioside M has proved challenging, as it commonly occurs only in low proportion to other major glycosides such as Reb A. Meanwhile, GLG’s agriculture team has been hard at work addressing the challenge through innovative yet natural agricultural methods. Building on its successes in iteratively developing high-Reb M stevia strains, the team recently filed a trio of patents with the Beijing patent office in China. GLG also expects to file for international protection on these patents through the Patent Cooperation Treaty.
Based on the hard work and extensive agronomic experience of our R&D team, these patent filings detail important and innovative non-GMO methods for the promotion of Reb M in the stevia leaf. Results from these three methods included a 117% increase in Reb M and a 174% increase in Reb M (relative to the leaf variety to which these methods were applied), as well as the development of stevia leaf that, while low in total steviol glycosides (TSG), had TSG comprising a remarkable 61% of Reb M. The GLG team is in the process of utilizing and expanding on these methods to bring to market Reb M extracts produced from Reb M molecules sourced purely from leaf. GLG expects this approach to result in Reb M extracts that are deemed more natural, more label-friendly, and more desirable than other approaches. GLG also expects that its more natural approach will prove to be cost-competitive with, if not more economical than, these other less label-friendly methods. GLG’s R&D team is also working on other non-GMO approaches to increase glycoside content including Reb M.
2018 AGM Voting Results
The Company held its Annual General Meeting on June 28, 2018, in Vancouver, B.C. The shareholders voted in all nominated directors, with favorable votes for each exceeding 99%. Dr. Luke Zhang continues as Chairman of the Board and Chief Executive Officer and Brian Palmieri continues as Vice Chairman of the Board
Results from Operations
The following results from operations have been derived from and should be read in conjunction with the Company’s annual consolidated financial statements for 2017 and the condensed interim consolidated financial statements for the nine-month period ended September 30, 2018.
Revenue
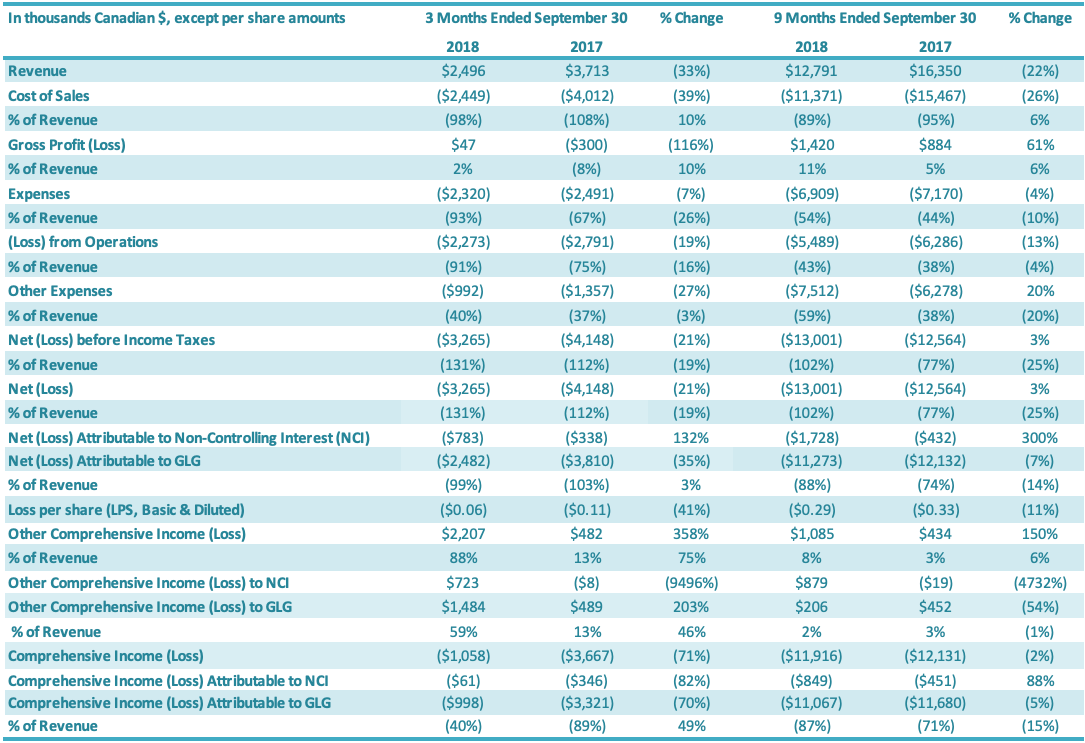
Revenue for the three months ended September 30, 2018, was $2.5 million compared to $3.7 million in revenue for the same period last year. Revenue for the quarter decreased by $1.2 million or 33% relative to the third quarter last year. This revenue decrease is attributable to both lower volumes sold and lower average product prices for stevia extracts, with lower prices reflecting both competitive pricing pressures as well as variation in the types of products sold to customers. Monk fruit revenues increased in the third quarter 2018, relative to the third quarter 2017, although monk fruit sales represented a relatively small portion of revenues in both periods. Overall, international sales represented 90% of total sales in the third quarter 2018, compared to 94% for the third quarter 2017.
Revenue for the nine months ended September 30, 2018, was $12.8 million compared to $16.4 million for the same period last year. Revenue for the period decreased by $3.6 million or 22% relative to the same period last year. This revenue decrease is attributable to both lower volumes sold and lower average product prices for stevia extracts, with lower prices reflecting both competitive pricing pressures as well as variation in the types of products sold to customers, as well as a decrease in monk fruit revenues, although monk fruit sales represented a relatively small portion of revenues in both periods. Overall, international sales represented 92% of total sales in the third quarter 2018, compared to 93% for the third quarter 2017.
Cost of Sales
For the quarter ended September 30, 2018, the cost of sales was $2.4 million compared to $4.0 million in cost of sales for the same period last year (a decrease of $1.6 million or 39%). Cost of sales as a percentage of revenues was 98% for the third quarter 2018, compared to 108% for the comparable period (an improvement of 10 percentage points). The 10 percentage point increase in cost of sales as a percentage of revenues for the third quarter, relative to the same period in 2017, is attributable to improved stevia margins on those sales resulting from improvements in production efficiencies and a change in product mix towards higher margin valued-added stevia products; these margin improvements were partially offset by a decrease in monk fruit margins. For the nine months ended September 30, 2018, the cost of sales was $11.4 million compared to $15.5 million for the same period of last year (a decrease of $4.1 million or 26%). Cost of sales as a percentage of revenues was 89% for the first nine months 2018, compared to 95% in the comparable period in 2017 (an improvement of 6 percentage points). The 6 percentage point improvement in cost of sales as a percentage of revenues for the nine months ended September 30, 2018, relative to the same period in 2017, is attributable to improved stevia margins on those sales resulting from improvements in production efficiencies and a change in product mix towards higher margin valued-added stevia products; these margin improvements were partially offset by a decrease in monk fruit margins.
Capacity charges charged to the cost of sales ordinarily would flow to inventory and are a significant component of the cost of sales. Only two of GLG’s manufacturing facilities were operating during the first nine months of 2018, and idle capacity charges of $1.6 million were charged to cost of sales (representing 14% of cost of sales) compared to $1.7 million charged to cost of sales in the same period of 2017 (representing 11% of cost of sales). The key factors that impact stevia and monk fruit cost of sales and gross profit percentages in each period include:
- Capacity utilization of stevia and monk fruit manufacturing plants
- The price paid for stevia leaf and monk fruit and their respective quality, which are impacted by crop quality for a particular year/period and the price per kilogram for which the stevia and monk fruit extracts are sold. These are the most important factors impacting the gross profit of GLG’s stevia and monk fruit business.
- Other factors which also impact stevia and monk fruit cost of sales to a lesser degree include:
- water and power consumption;
- manufacturing overhead used in the production of stevia and monk fruit extract, including supplies, power and water;
- net VAT paid on export sales;
- exchange rate changes; and
- depreciation.
GLG’s stevia and monk fruit businesses are affected by seasonality. The harvest of the stevia leaves typically occurs starting at the end of July and continues through the fall of each year. The monk fruit harvest takes place typically from October to December each year. GLG’s operations in China are also impacted by Chinese New Year celebrations, which occur approximately late-January to mid-February each year, and during which many businesses close down operations for approximately two weeks. GLG’s production year runs October 1 through September 30 each year.
Gross Profit
Gross profit for the three months ended September 30, 2018, was $nil, compared to gross loss of $0.3 million for the comparable period in 2017 or a 116% improvement. The gross profit margin was 2% in the third quarter 2018 and negative 8% for the same period in 2017, or an improvement of 10 percentage points. The 10 percentage point increase in gross profit for the third quarter of 2018, relative to the comparable period in 2017, is attributable to improved stevia margins on those sales resulting from improvements in production efficiencies and a change in product mix towards higher margin valued-added stevia products; these margin improvements were partially offset by a decrease in monk fruit margins. Gross profit for the first nine months in 2018 was $1.4 million, compared to $0.9 million for the comparable period in 2017 or a 61% increase. The gross profit margin was 11% for the first nine months of 2018 and 5% for the same period in 2017, or an improvement of 6 percentage points. The 6 percentage point increase in gross profit for the nine months ended September 30, 2018, relative to the comparable period in 2017, is attributable to improved stevia margins on those sales resulting from improvements in production efficiencies and a change in product mix towards higher margin valued-added stevia products; these margin improvements were partially offset by a decrease in monk fruit margins.
Selling, General, and Administration Expenses
Selling, General and Administration (“SG&A”) expenses include sales, marketing, general and administration costs (“G&A”), stock-based compensation, and depreciation and amortization expenses on G&A fixed assets. A breakdown of SG&A expenses into these components is presented below:
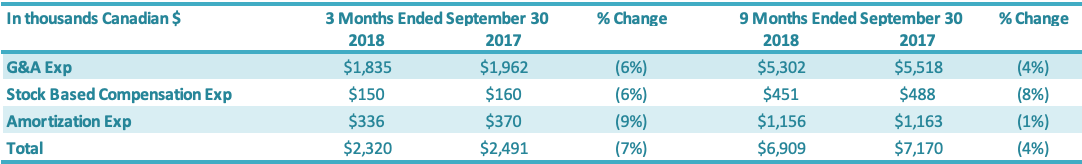
G&A expenses for the three months ended September 30, 2018, were $1.8 million compared to $1.9 million in the same period in 2017 (an improvement of $0.1 million or 6%). Stock-based compensation was $0.2 million for the three months ended September 30, 2018, compared to $0.2 million in the comparable period in 2017. The number of common shares available for issue under the stock compensation plan is 10% of the issued and outstanding common shares. During the quarter, compensation from vesting stock-based compensation awards was recognized, due to previously granted options and restricted shares. G&A-related depreciation and amortization expenses for the three months ended September 30, 2018, were $0.3 million compared with $0.4 million for the same quarter of 2017.
G&A expenses for the first nine months ended September 30, 2018, were $5.3 million compared to $5.5 million in the same period in 2017 or a 4% reduction. Stock-based compensation was $0.5 million for the nine months ended September 30, 2018, compared with $0.5 million in the same quarter of 2017. The number of common shares available for issue under the stock compensation plan is 10% of the issued and outstanding common shares. During the period, compensation from vesting stock-based compensation awards was recognized, due to previously granted options and restricted shares. G&A-related depreciation and amortization expenses for the nine months ended September 30, 2018, were $1.2 million compared with $1.2 million for the same period of 2017.
Other Expenses

Other expenses for the three months ended September 30, 2018, was $1.0 million, a $0.4 million decrease compared to $1.4 million for the same period in 2017. The decrease in other expenses for the third quarter of 2018 of $0.4 million is attributable to increases in (1) foreign exchange gains ($0.8 million) and (2) other income ($0.1 million), which was offset by (3) an increase in interest expenses ($0.4 million) and (4) a decrease in recoveries against inventory impairments ($0.1 million). Other expenses for the nine months ended September 30, 2018, was $7.5 million, a $1.2 million increase compared to $6.3 million for the same period in 2017. The increase in other expenses for the nine months ended September 30, 2018, of $1.2 million is attributable to (1) a decrease in foreign exchange gain ($1.1 million), (2) an increase in interest expenses ($0.2 million) and (3) a decrease in recoveries against inventory impairments ($0.2 million), which were offset by (4) an increase in other income ($0.2 million).
Foreign Exchange Gains (Losses)
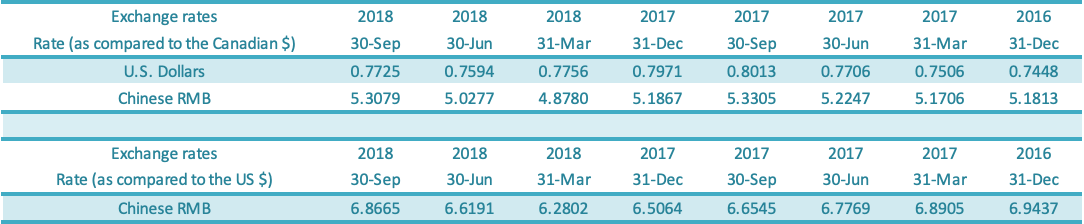
GLG reports in Canadian dollars but earns revenues in US dollars and Chinese renminbi (“RMB”) and incurs most of its expenses in RMB. Impacts of the appreciation or depreciation of the RMB against the Canadian dollar are shown separately in Accumulated Other Comprehensive Income (“AOCI”) on the Balance Sheet. As at September 30, 2018, the exchange rate for RMB per Canadian dollar was 5.3079 compared to the exchange rate of 5.1867 as at December 31, 2017, reflecting a depreciation of the RMB against the Canadian dollar. As at September 30, 2018, the exchange rate for USD per Canadian dollar was 0.7725 compared to the exchange rate of 0.7971 as at December 31, 2017, reflecting an appreciation of the USD against the Canadian dollar. The balance of the AOCI was $9.4 million on September 30, 2018, compared to a balance of $9.2 million as at December 31, 2017.
The foreign exchange gain or loss is made up of realized and unrealized gains or losses due to the depreciation or appreciation of the foreign currency against the Canadian dollar. Foreign exchange gain was $1.6 million for the third quarter of 2018 compared to the foreign exchange gain of $0.8 million for the comparable period in 2017. Foreign exchange gain was $nil for the nine-month period in 2018 compared to the foreign exchange gain of $1.1 million for the comparable period in 2017. The table above shows the change in the Canadian dollar relative to the US dollar from December 31, 2016, to September 30, 2018, and the exchange rate movement for the Canadian dollar relative to the US dollar and RMB as shown above.
Net Loss
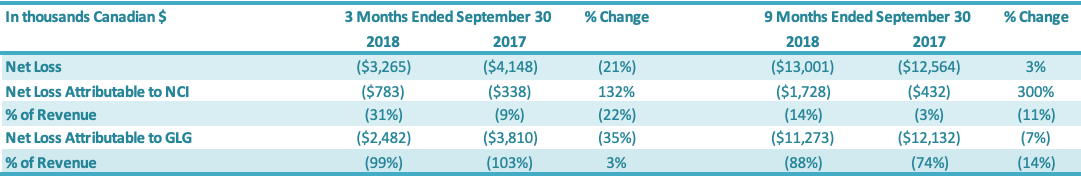
For the three months ended September 30, 2018, the Company had a net loss attributable to the Company of $2.5 million, a decrease of $1.3 million or a 35% improvement over the comparable period in 2017 ($3.8 million loss). The $1.3 million decrease in net loss was driven by increases in (1) gross profit ($0.3 million) and (2) net loss attributable to the non-controlling interest ($0.4 million) and decreases in (3) SG&A expenses ($0.2 million) and (4) other expenses ($0.4 million). For the nine months ended September 30, 2018, the Company had a net loss attributable to the Company of $11.3 million, a decrease of $0.9 million or a 7% decrease over the comparable period in 2017 ($12.1 million loss). The $0.9 million decrease in net loss was driven by: (1) an increase in gross profit ($0.5 million), (2) a decrease in SG&A expenses ($0.3 million) and (3) an increase in net loss attributable to the non-controlling interest ($1.3 million), which were offset by (4) an increase in other expenses ($1.2 million).
Comprehensive Loss
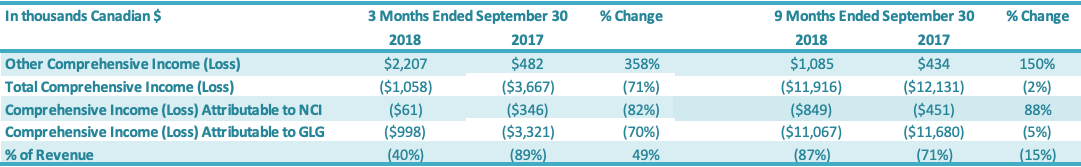
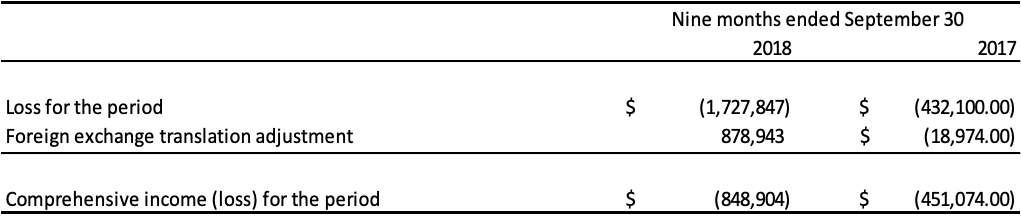
The Company recorded total comprehensive loss of $1.0 million for the three months ended September 30, 2018, comprising $2.5 million of net loss attributable to the Company and $1.5 million of other comprehensive income attributable to the Company. The Company recorded total comprehensive loss of $3.3 million for the three months ended September 30, 2017, comprising $3.8 million of net loss attributable to the Company and $0.5 million of other comprehensive income attributable to the Company. The Company recorded total comprehensive loss of $11.1 million for the nine months ended September 30, 2018, comprising $11.3 million of net loss attributable to the Company and $0.2 million of other comprehensive income attributable to the Company. The Company recorded total comprehensive loss of $11.7 million for the nine months ended September 30, 2017, comprising $12.1 million of net loss and $0.4 million of other comprehensive income attributable to the Company.
Summary of Quarterly Results
The selected consolidated information below has been gathered from GLG’s quarterly condensed interim consolidated financial statements for the previous eight quarterly periods.
Quarterly Net Loss
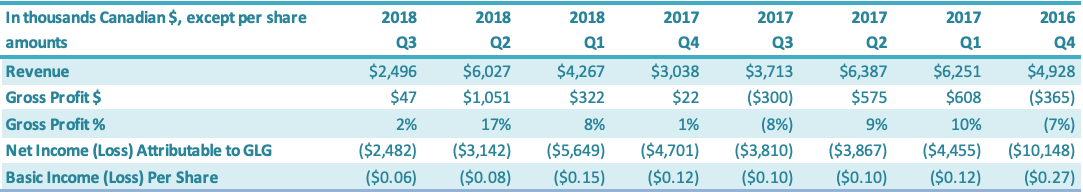
For the three months ended September 30, 2018, the Company had a net loss attributable to the Company of $2.5 million, a decrease of $1.3 million or a 35% improvement over the comparable period in 2017 ($3.8 million loss). The $1.3 million decrease in net loss was driven by increases in (1) gross profit ($0.3 million) and (2) net loss attributable to the non-controlling interest ($0.4 million) and decreases in (3) SG&A expenses ($0.2 million) and (4) other expenses ($0.4 million). For the three months ended June 30, 2018, the Company had a net loss attributable to the Company of $3.1 million, a decrease of $0.8 million or a 19% improvement over the comparable period in 2017 ($3.9 million loss). The $0.8 million decrease in net loss was driven by (1) an increase in gross profit ($0.5 million), (2) a decrease in SG&A expenses ($0.1 million) and (3) an increase in net loss attributable to the non-controlling interest ($0.4 million), which were offset by (4) an increase in other expenses ($0.2 million). For the three months ended March 31, 2018, the Company had a net loss attributable to the Company of $5.6 million, an increase of $1.2 million or 61% over the comparable period in 2017 ($4.5 million). The increased net loss was driven by (1) an increase in other expenses of $1.3 million and (2) a decrease in gross profit of $0.3 million, which were offset by losses attributable to non-controlling interests of $0.4 million.
For the three months ended December 31, 2017, the Company had a net loss attributable to the Company of $4.7 million, a decrease of $5.4 million or a 54% improvement over the comparable period in 2016 ($10.1 million loss). The decrease in net loss was driven by (1) an increase in gross profit of $0.4 million, (2) a decrease in SG&A expenses of $1.9 million, (3) a decrease in other expenses of $2.8 million and (4) an increase in loss of $0.3 million attributable to non-controlling interests. For the three months ended September 30, 2017, the Company had a net loss of $3.8 million, a decrease of $1.5 million or a 28% improvement over the comparable period in 2016 ($5.3 million loss). The $1.5 million decrease in net loss was driven by (1) a decrease in other income (expenses) ($1.2 million), (2) a decrease in SG&A expenses ($0.2 million) and (3) an increase in the net loss attributable to the non-controlling interest ($0.3 million), which were offset by a decrease in gross profit ($0.2 million). For the three months ended June 30, 2017, the Company had a net loss of $3.9 million, a decrease of $0.1 million or an 4% improvement over the comparable period in 2016 ($4.0 million loss). The $0.1 million decrease in net loss was driven by (1) an increase in gross profit ($0.6 million), (2) a decrease in SG&A expenses ($0.5 million) and (3) $0.1 million of net loss attributable to the non-controlling interest, which were offset by (4) an increase in other expenses ($1.0 million).
For the three months ended March 31, 2017, the Company had a net loss of $4.4 million, an increase of $0.1 million or 3% over the comparable period in 2016 ($4.3 million). The $0.1 million increase in net loss was due to (1) an increase in other expenses ($1.4 million), mainly attributable to a $0.9 million increase in foreign exchange loss and a $0.5 million decrease in bad debt recovery, which was offset by (2) an increase in gross profit ($0.5 million) and (3) a decrease in G&A expenses ($0.8 million). For the three months ended December 31, 2016, the Company had a net loss attributable to the Company of $10.1 million, a decrease of $1.4 million or a 12% improvement over the comparable period in 2015 ($11.6 million loss). The decrease in net loss was driven by (1) a decrease in other expenses of $1.3 million and (2) a decrease in SG&A expenses of $0.7 million, which were offset by (3) a decrease in gross profit $0.6 million.
Quarterly Basic and Diluted Loss per Share
The basic loss and diluted loss per share from operations was $0.06 for the three months ended September 30, 2018, compared with a basic and diluted net loss of $0.11 for the comparable period in 2017. For the three months ended September 30, 2018, the Company had a net loss attributable to the Company of $2.5 million, a decrease of $1.3 million or a 35% improvement over the comparable period in 2017 ($3.8 million loss). The $1.3 million decrease in net loss was driven by increases in (1) gross profit ($0.3 million) and (2) net loss attributable to the non-controlling interest ($0.4 million) and decreases in (3) SG&A expenses ($0.2 million) and (4) other expenses ($0.4 million). The basic loss and diluted loss per share from operations was $0.08 for the three months ended June 30, 2018, compared with a basic and diluted net loss of $0.10 for the comparable period in 2017. For the three months ended September 30, 2018, the Company had a net loss attributable to the Company of $3.1 million, a decrease of $0.8 million or a 19% improvement over the comparable period in 2017 ($3.9 million loss). The $0.8 million decrease in net loss was driven by (1) an increase in gross profit ($0.5 million), (2) a decrease in SG&A expenses ($0.1 million) and (3) an increase in net loss attributable to the non-controlling interest ($0.4 million), which were offset by (4) an increase in other expenses ($0.2 million). The basic loss and diluted loss per share from operations was $0.15 for the three months ended March 31, 2018, compared with a basic and diluted net loss of $0.12 for the comparable period in 2017. For the three months ended March 31, 2018, the Company had a net loss attributable to the Company of $5.6 million, an increase of $1.2 million or 61% over the comparable period in 2017 ($4.5 million). The increased net loss was driven by (1) an increase in other expenses of $1.3 million and (2) a decrease in gross profit of $0.3 million, which were offset by losses attributable to non-controlling interests of $0.4 million. The basic loss and diluted loss per share from operations was $0.12 for the three months ended December 31, 2017, compared with a basic and diluted net loss of $0.27 for the same period in 2016. For the three months ended December 31, 2017, the Company had a net loss attributable to the Company of $4.7 million, a decrease of $5.4 million or a 54% improvement over the comparable period in 2016 ($10.1 million loss). The decrease in net loss was driven by (1) an increase in gross profit of $0.4 million, (2) a decrease in SG&A expenses of $1.9 million, (3) a decrease in other expenses of $2.8 million and (4) an increase in loss of $0.3 million attributable to non-controlling interests.
The basic loss and diluted loss per share from operations was $0.10 for the three months ended September 30, 2017, compared with a basic and diluted net loss of $0.14 for the same period in 2016. For the three months ended September 30, 2017, the Company had a net loss of $3.8 million, a decrease of $1.5 million or a 28% improvement over the comparable period in 2016 ($5.3 million loss). The $1.5 million decrease in net loss was driven by (1) a decrease in other income (expenses) ($1.2 million), (2) a decrease in SG&A expenses ($0.2 million) Page 17 of 31 and (3) an increase in the net loss attributable to the non-controlling interest ($0.3 million), which were offset by a decrease in gross profit ($0.2 million).
The basic loss and diluted loss per share from operations was $0.10 for the three months ended June 30, 2017, compared with a basic and diluted net loss of $0.11 for the same period in 2016. For the three months ended September 30, 2017, the Company had a net loss of $3.9 million, a decrease of $0.1 million or an 4% improvement over the comparable period in 2016 ($4.0 million loss). The $0.1 million decrease in net loss was driven by (1) an increase in gross profit ($0.6 million), (2) a decrease in SG&A expenses ($0.5 million) and (3) $0.1 million of net loss attributable to the non-controlling interest, which were offset by (4) an increase in other expenses ($1.0 million). The basic loss and diluted loss per share from operations was $0.12 for the three months ended March 31, 2017, compared with a basic and diluted net loss of $0.11 for the comparable period in 2016. For the three months ended March 31, 2017, the Company had a net loss of $4.4 million, an increase of $0.1 million or a 3% increase over the comparable period in 2016 ($4.3 million). The $0.1 million increase in net loss was due to (1) an increase in other expenses ($1.4 million), mainly attributable to a $0.9 million increase in foreign exchange loss and a $0.5 million decrease in bad debt recovery, which was offset by (2) an increase in gross profit ($0.5 million) and (3) a decrease in G&A expenses ($0.8 million). The basic loss and diluted loss per share from operations was $0.27 for the three months ended December 31, 2016, compared with a basic and diluted net loss from both continuing and discontinued operations of $0.31 for the same period in 2015. For the three months ended December 31, 2016, the Company had a net loss attributable to the Company of $10.1 million, a decrease of $1.4 million or a 12% improvement over the comparable period in 2015 ($11.6 million loss). The decrease in net loss was driven by (1) a decrease in other expenses of $1.3 million and (2) a decrease in SG&A expenses of $0.7 million, which were offset by (3) a decrease in gross profit $0.6 million.
NON-GAAP Financial Measures
Gross Profit Before Capacity Charges
This non-GAAP financial measure shows the gross profit (loss) before the impact of idle capacity charges are reflected on the gross profit margin. GLG had only 50% of its production facilities in operation for the first nine months of 2018 and idle capacity charges have a material impact on the gross profit (loss) line in the financial statements.
Gross profit before capacity charges for the three months ended September 30, 2018, was $0.6 million or 24% of third quarter revenues compared to $0.3 million or 9% of third quarter revenues in 2017. Gross profit before capacity charges for the nine months ended September 30, 2018, was $3.0 million or 24% of nine-month revenues compared to $2.5 million or 16% of nine-month revenues in 2017. Gross profit before capacity charges for both the three- and nine-month periods in 2018 increased from the comparable periods due primarily to improved margins on international stevia sales compared to the previous year, resulting from improvements in production efficiencies and a change in product mix towards higher margin valued-added stevia products.
Earnings Before Interest Taxes and Depreciation (“EBITDA”) and EBITDA Margin
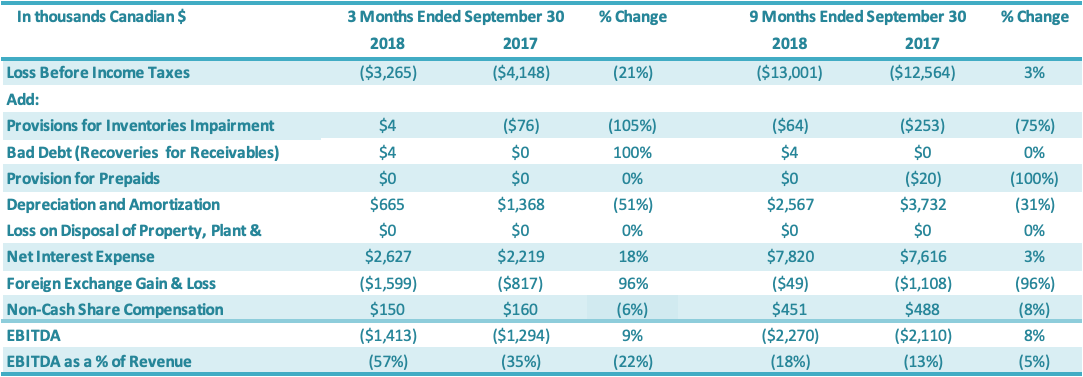
EBITDA for the three months ended September 30, 2018, was negative $1.4 million or negative 57% of revenues, a $0.1 million or 22 percentage point decrease over the same period in 2017 (negative $1.3 million or negative 35% of revenues). This decrease in EBITDA for the quarter is primarily attributable to lower sales, partly offset by improvements in gross margins attributable to both improvements in production efficiencies and a change in product mix towards higher margin valued-added stevia products as well as reductions in SG&A for the period ending September 30, 2018, compared to the prior period. EBITDA for the nine months ended September 30, 2018, was negative $2.3 million or negative 18% of revenues, a $0.2 million or 5 percentage point decrease over the same period in 2017 (negative $2.1 million or negative 13% of revenues). This decrease in EBITDA for the first nine months is primarily attributable to lower sales, partly offset by improvements in gross margins attributable to both improvements in production efficiencies and a change in product mix towards higher margin valued-added stevia products as well as reductions in SG&A for the period ending September 30, 2018, compared to the prior period.
Liquidity and Capital Resources
The Company continues to progress with the following measures to manage cash flow of the Company: reducing accounts payable, negotiating with creditors for extended payment terms, working closely with the banks to restructure its loans, arranging additional short-term loans with major customers, arranging financing with its Directors and other related parties, and reducing operating expenditures including general and administrative expenses and production-related expenses. Total loans payable is $99.4 million as of September 30, 2018, an increase of $6.3 million compared to the total loans payable as at December 31, 2017 ($93.2 million). The increase in total loans payable of $6.3 million is attributable to (1) an increase in the amounts due to related parties ($3.8 million) and (2) an increase in shortterm loans from a major customer (Archer Daniels Midland Company) ($3.7 million), which were offset by (3) foreign exchange impacts ($1.3 million) due to the appreciation of the USD against the Canadian dollar as well as the depreciation of the RMB against the Canadian dollar. The Company continues to work with its Chinese banks on restructuring its Chinese debt in 2018. 98% of all China bank loans held by GLG’s Chinese subsidiary – Anhui Runhai Biotechnology Joint Stock Company, Ltd. (“Runhai”) – have been transferred to one state-owned capital management company (“SOCMC”). China Cinda Assets Management Anhui Branch (“Cinda”) is the sole SOCMC holding the 98% of short-term bank debt. The Company is in the final stage of negotiation with Cinda to convert that debt into equity in Runhai with a view to participate as an equity shareholder in the potential returns. Cinda could also be a source of possible future capital. Until the final debt restructuring is completed, the terms of the original loans are represented in the financial statements. In addition, the Company successfully arranged a $4 million secured zero-interest short term loan with its major customer ADM during the third quarter as well as additional short term financings from related family members to assist with short-term working capital requirements.
Cash Flows: Three Months Ended September 30, 2018 and 2017
Cash generated in operating activities was $0.2 million in the three-month period ended September 30, 2018, compared to $0.4 million generated by operating activities in the same period of 2017. Cash generated in operating activities decreased by $0.2 million year-over-year. This was the result of (1) an increase of cash used in operating activities before the impact of non-cash working capital of $0.8 million, which was offset by (2) an increase of cash generated by non-cash working capital of $0.6 million for the three months ended September 30, 2018, relative to the comparative 2017 period. The $0.6 million increase in non-cash working capital was due to increases in cash from (1) accounts receivables ($0.9 million), (2) amounts from related party (current) ($1.1 million), (3) inventories ($0.8 million) and (4) interest payable ($0.5 million), which were offset by increases in cash used by (5) accounts payable and accruals ($2.3 million) and (6) prepaid expenses and taxes recoverable ($0.5 million).
Cash used by investing activities was $nil during the third quarter of 2018, compared to cash used by investing activities of $0.1 million in the same period in 2017. Cash generated in financing activities was $4.3 million in the third quarter of 2018 compared to $2.0 million in the same period in 2017 or an increase of $2.3 million. The $2.3 million net increase in cash generated by financing activities in the third quarter of 2018, compared to the prior period, was due to the issuance of (1) net increases of short-term loans for working capital of $4 million which were offset by (2) net decreases in cash from advances by related parties of $1.7 million.
Cash Flows: Nine Months Ended September 30, 2018 and 2017
Cash generated in operating activities was $0.8 million in the nine-month period ended September 30, 2018, compared to $0.9 million generated in operating activities in the same period of 2017. Cash generated in operating activities decreased by $0.1 million year-over-year. This decrease was the result of (1) an increase in cash used in operating activities before the impact of non-cash working capital of $3.0 million, which was offset by (2) cash generated by non-cash working capital of $2.9 million in the nine months ended September 30, 2018, compared to the prior period. The $2.9 million increase in non-cash working capital was due to increases in cash provided from (1) inventories ($1.9 million), (2) due to related party (current) ($2.8 million), (3) interest payable ($0.6 million), and (4) deferred revenues ($0.3 million), which were offset by increases in cash used in (5) accounts receivable ($1.1 million), (6) accounts payable ($0.7 million) and (7) prepaid expenses and taxes recoverable ($0.9 million).
Cash used by investing activities was $0.1 million during the nine-month period of 2018, compared to cash used by investing activities of $0.3 million in the same period in 2017. Cash generated in financing activities was $4.4 million in the nine-month period of 2018 compared to $1.7 million in the same period in 2017 or a net increase of $2.7 million. The net increase of $2.7 million in cash generated by financing activities in the nine months ended September 30, 2018, compared to the prior period, was due to the issuance of (1) net increases of short-term loans for working capital of $4 million which was offset by (2) net decreases in advances by related parties of $1.3 million.
Financial Resources
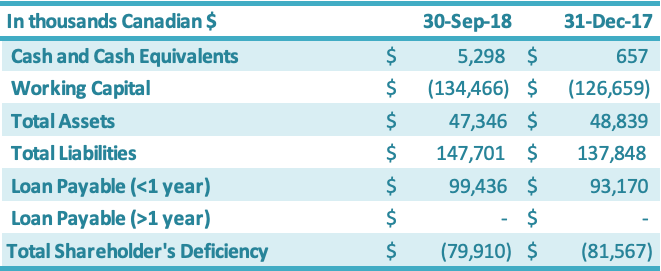
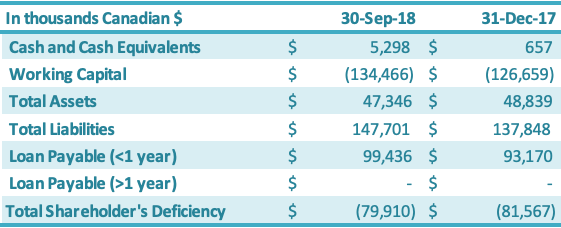
Cash and cash equivalents increased by $4.6 million during the nine months ended September 30, 2018, from December 31, 2017, driven by a new secured zero-interest $4 million loan from its major customer and additional short-term financing from a related party ($0.6 million). Working capital decreased by $7.8 million from the year-end 2017 position to negative $137.5 million.
The working capital decrease of $7.8 million is attributable to an increase in current liabilities of $9.8 million, offset by an increase in current assets of $2.0 million. The $9.8 million increase in current liabilities was due to increases in (1) due to related parties ($3.9 million), (2) interest payable ($3.6 million), (3) short-term loans ($2.3 million) and (4) liabilities on derivatives ($0.2 million), which were offset by (5) a decrease in accounts payable ($0.2 million). The $2.0 million increase in current assets is attributable to increases in (1) cash ($4.6 million) and (2) prepaid expenses ($0.4 million), which were offset by decreases in (3) inventory ($2.7 million), (4) sales taxes recoverable ($0.2 million) and (5) accounts receivable ($0.1 million). The Company has been working on improving its working capital deficiency situation, which was driven by the impairments to inventory, accounts receivable, sales taxes recoverable, prepaid expenses and land use rights over the years 2011 – 2017 (these impairments totaled approximately $123 million as of December 31, 2017). See above section on Liquidity and Capital Resources for additional details on the Company’s debt restructuring progress and new short-term loans. The Company’s working capital and working capital requirements fluctuate from quarter to quarter depending on, among other factors, the annual stevia harvest in China (third and fourth quarter each year) and the production output along with the amount of sales conducted during the period. The value of raw material in inventory has historically been the highest in the fourth quarter due to the fact that the Company purchases leaf during the third and fourth quarter and monk fruit during the fourth quarter for the entire production year, which runs October through September each year. The Company’s principal working capital needs include accounts receivable, taxes receivable, inventory, prepaid expenses, other current assets, and accounts payable and interest payable.
Balance Sheet
As at September 30, 2018, in comparison to December 31, 2017, the total assets decreased by $1.5 million. This increase was split between an increase in current assets of $2.0 million and a decrease in fixed assets of $3.5 million. The $2.0 million increase in the current assets was driven by increases in (1) cash and cash equivalents ($4.6 million) and (2) prepaid expenses ($0.4 million), which were offset by decreases in (3) inventory ($2.7 million), (4) sales taxes recoverable ($0.2 million) and (5) accounts receivable ($0.1 million). The net decrease in the fixed assets of $3.5 million was due primarily to (1) an increase in amortization ($3.0 million) and (2) depreciation of the RMB against the Canadian dollar ($0.7 million), which were offset by (3) an increase in fixed assets ($0.2 million). Current liabilities increased by $9.8 million as at September 30, 2018, in comparison to December 31, 2017. The $9.8 million increase resulted from (1) negative $2.7 million in foreign exchange impacts and (2) a $12.5 million increase resulting from increases in interest payable ($4.3 million),short-term loans ($3.9 million), due to related parties ($3.9 million), accounts payable ($0.2 million) and liabilities on derivatives ($0.2 million). Shareholders’ deficiency decreased by $1.7 million due to increases in (1) contributed surplus ($12.1 million), (2) share capital ($0.7 million) and (3) accumulated other comprehensive income ($0.2 million), which were offset by (4) an increase in deficit ($11.3 million).
Short-Term Loans
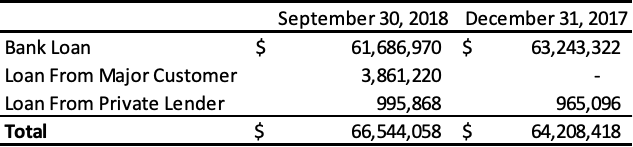
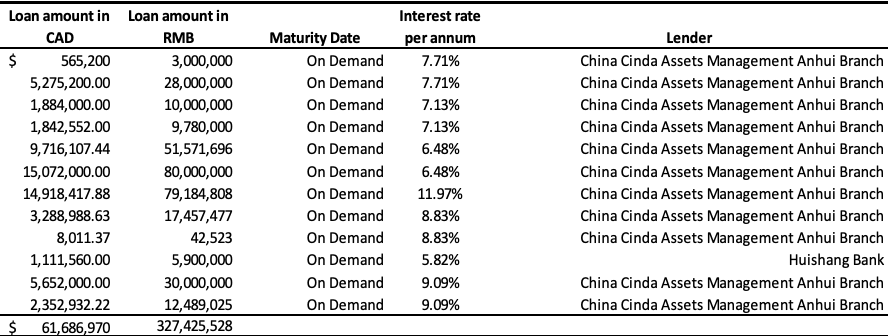
The Company’s short-term loans consisted of borrowings from various banks in China of $61,686,970 (December 31, 2017 – $63,243,322), a zero-interest loan from a major customer (Archer Daniels Midland Company or “ADM”) of $3,861,220 (2017 – $nil), and loans from private lenders of $995,868 (2017 – $965,096) as follows:
Bank loans as at September 30, 2018:
Bank loans as at December 31, 2017:
The Company has been working with its Chinese banks and SOCMCs on restructuring its debt during the quarter ended September 30, 2018.
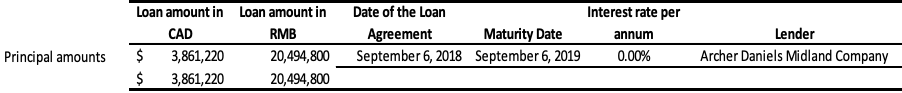
Short-term Borrowing from Major Customers:
In the third quarter of 2018, ADM issued a zero-interest RMB-denominated loan to the Company to facilitate the purchase of raw materials for its stevia extracts. The loan principal amount as of September 30, 2018, is $3,861,220 (20,494,800 RMB) (2017 – $nil). Loan principal repayments are tied to the timing and amounts of those raw materials that are used in production.
Short-term Borrowing from Private Lenders:
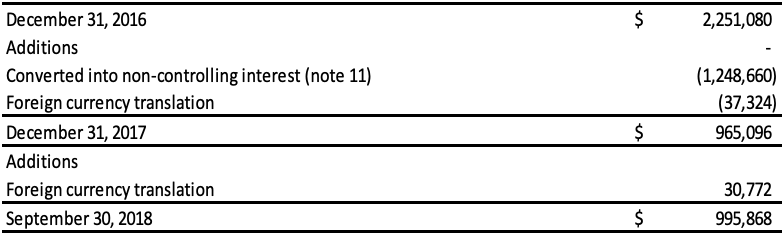
Short-term borrowing from private lenders consists of two loans. The first loan principal amount as of September 30, 2018, is $995,868 (2017 – $965,096) and bears interest at 11.50% per annum, compounding quarterly. The loan is due on demand and does not have any attached covenants. The second loan principal amount as of September 30, 2018, is $nil (2017 – $nil) and bears interest at 20% per annum, compounding quarterly. During 2017, the principal on the second loan was converted into equity interest in Runhai, the Company’s Chinese subsidiary (see Note 11). The interest payable on the loan remains due on demand and does not have any attached covenants. This interest payable provides a repayment option to the lender in either RMB or USD using a fixed foreign exchange rate of 6.1234 RMB/USD. This option results in a liability of $13,071 (2017 – $6,509), which is accounted as liabilities on derivatives and included in unrealized foreign exchange losses. The fair value of the liability on derivatives was calculated using the Black-Scholes model with the following assumptions:

Financial and Other Instruments
The Company’s financial instruments comprise cash and cash equivalents (classified as “held-for-trading”), accounts receivable and certain other assets that are financial instruments (classified as “loans and receivables”), and short-term loans, accounts payable, interest payable, advance from customer, due to related party, and noncurrent bank loans (classified as “other financial liabilities”). The Company currently does not have any hedge instruments.
As at September 30, 2018, the Company recorded cash and cash equivalents at fair value. Recorded amounts for accounts receivable, accounts payable and accrued liabilities, short-term loans, interest payable, advances from customers, and due to related party approximate their fair values due to the short-term nature of these instruments. Credit risk is the risk of loss associated with a counterparty’s inability to fulfill its payment obligations. The Company’s primary credit risk is on its cash and cash equivalents, restricted cash and accounts receivable. The Company limits its exposure to credit risk by placing its cash and cash equivalents with various financial institutions. Given the current economic environment, the Company monitors the credit quality of the financial institutions it deals with on an ongoing basis.
The majority of the Company’s assets are held in subsidiaries whose functional currency is the RMB. The RMB is not a freely convertible currency. Many foreign currency exchange transactions involving RMB, including foreign exchange transactions under the Company’s capital account, are subject to foreign exchange controls and require the approval of the PRC State Administration of Foreign Exchange. Developments relating to the PRC’s economy and actions taken by the PRC government could cause future foreign exchange rates to vary significantly from current or historical rates. The Company cannot predict nor give any assurance of its future stability. Future fluctuations in exchange rates may adversely affect the value when translated or converted into Canadian dollars of the Company’s net assets and net profits. The Company cannot give any assurance that any future movements in the exchange rates of RMB against the Canadian dollar and other foreign currencies will not adversely affect its results of operations, financial condition and cash flows. The Company does not use derivative instruments to reduce its exposure to foreign currency risk. All of the Company’s operations in China are considered self-sustaining operations. The assets and liabilities of the self-sustaining operations are translated at exchange rates prevailing at the balance sheet date. See the Company’s December 31, 2017, year-end consolidated financial statements (Note 23) for further information on its financial and other instruments.
Contractual Obligations
Operating Leases
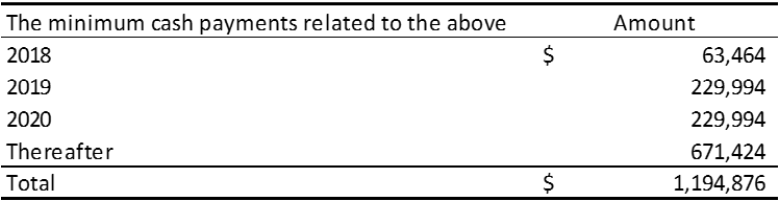
The Company renewed one five-year operating lease with respect to production equipment at the Qingdao Runde factory in China. The lease expires on December 31, 2021. The annual minimum lease payment is approximately $94,000 (RMB 500,000).
The Company signed a twenty-year land rental agreement in Qingdao. The agreement was signed on February 16, 2005, and expires on February 16, 2025. Currently, the Company is in the third five-year period of that agreement with rent expense of approximately $2,570 (RMB 13,642) per year. In the fourth five-year period, the rent expense is approximately $3,002 (RMB 15,934) per year. With the same vendor the Company also signed another rental agreement for the adjacent land from November 8, 2006, to November 7, 2036. The annual rental expense is approximately $5,384 (RMB 28,576). The Company’s current office premises are leased under an eight-year agreement beginning August 1, 2016, and will expire on July 31, 2024. The nine-month lease payments ended September 30, 2018, total $131,980 (2017 – $130,035).

Capital Structure
Outstanding Share Data as at the date of this MD&A:
Off-Balance Sheet Arrangements
The Company had no off-balance sheet arrangements.
Non-Controlling Interests
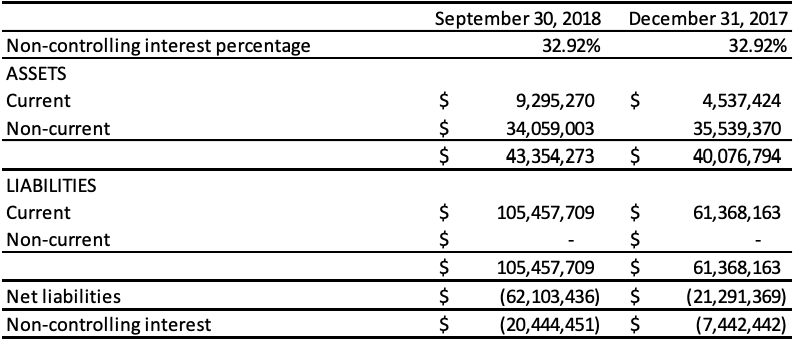
During 2017, the Company disposed of 32.92% of its ownership in Runhai to its related parties in order to settle $15,971,767 (RMB 80,584,090) in related party loans. Accordingly, the Company de-recognized the derivative liabilities related to this portion of the loans totaling $274,538. The related party loans were converted to a 32.92% ownership share in Runhai. The reduction in the Company’s ownership interest in Runhai did not result in a loss of control and was recorded as equity transactions. In connection with the recognition of non-controlling interest, the proportionate share of the cumulative amount of foreign exchange translation differences recognized in other comprehensive income totaling $3,649,111 was re-attributed to the non-controlling interest in Runhai. In addition, the Company incurred transaction costs totaling $563,154 and this amount was deducted from equity. The carrying amount of non-controlling interests was adjusted to reflect the change in the noncontrolling interests’ relative interests in the subsidiary and the difference between the adjustment to the carrying amount of non-controlling interests and the Company’s share of proceeds received and/or consideration paid is recognized directly in equity and attributed to shareholders of the Company.
On June 1, 2018, the Company transferred its ownership interest in its Qingdao Runde Biotechnology Company, Ltd. (“Runde”) subsidiary to its Anhui Runhai Biotechnology Joint Stock Company, Ltd. (“Runhai”). As the Company has a 67.08% interest in Runhai, with 32.92% held by a related party, the effect of this transfer was a disposition of 32.92% of its ownership interest in Runde. The reduction in the Company’s ownership interest in Runhai did not result in a loss of control and was recorded as equity transactions. As a result of this transaction, all previous China subsidiaries are solely owned by Runhai and the Company owns 67.08% of Runhai.
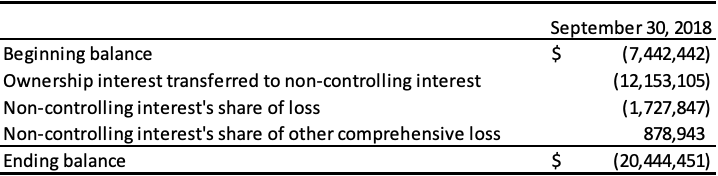
The following table represents the equity attributable to the non-controlling interest:
The following table presents the non-controlling interest as at September 30, 2018, and 2017:
The following table presents the loss and comprehensive income attributable to the non-controlling interest for the period ended September 30, 2018 and year ended December 31, 2017:
Transactions with Related Parties
Transactions with Key Management Personnel
Key management personnel are those persons who have the authority and responsibility for planning, directing, and controlling activities of the Company directly or indirectly, including any external director of the Company.
Remuneration of key management of the Company is comprised of the following expenses:
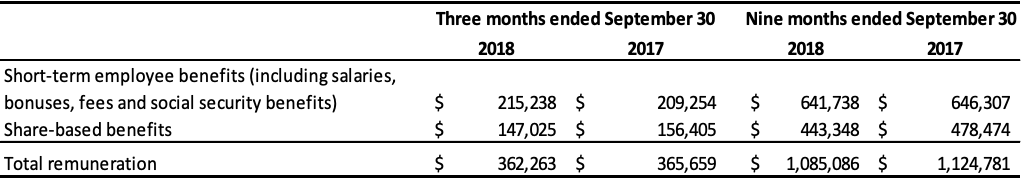
Certain executive officers are subject to termination benefits. Upon resignation at the Company’s request or in the event of a change in control, they are entitled to termination benefits ranging from 24 to 36 months of gross salary, totaling approximately $1,856,000. Key management exercised 154,000 stock options granted under the Company’s stock option plan in the nine months ended September 30, 2018.
Amount Due to Related Parties
The amounts due to related parties are shown in the following table:
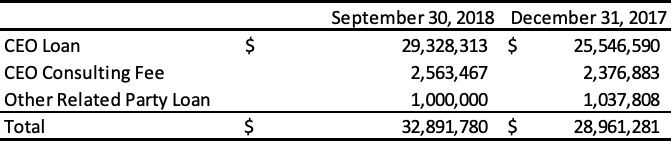
- As of September 30, 2018, the Company has accrued $2,563,467 (2017 – $2,376,883) including 3% interest per annum in consulting fees to the Company’s Chairman and Chief Executive Officer.
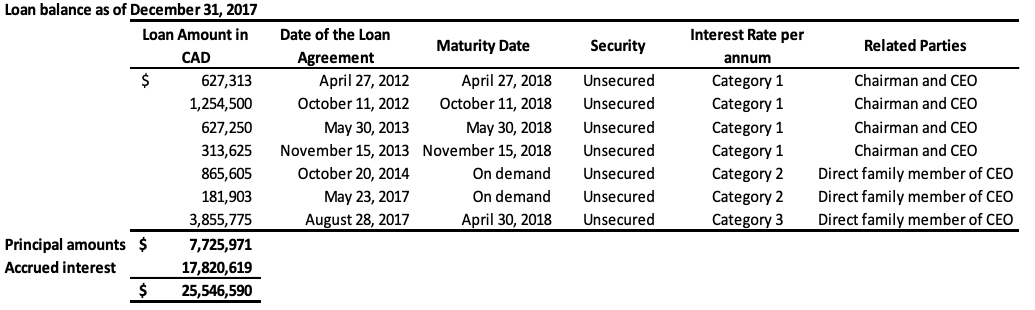
- The Company has obtained loans under numerous credit facility agreements from the Company’s Chairman and Chief Executive Officer (“CEO”). As at September 30, 2018, the total amount owed to the CEO under these facilities, including principal and accumulated interest, is $6,384,093 (2017 – $5,586,969). As at September 30, 2018, the entire balance owed is due within 12 months and is therefore classified as current on the statement of financial position.
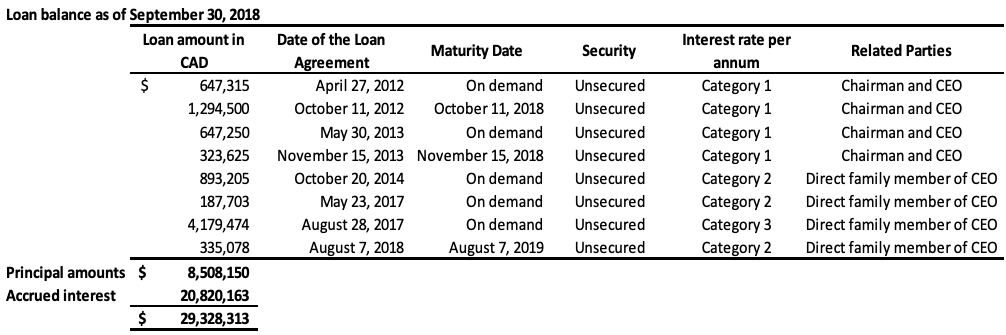
The Company has also obtained loans under numerous credit facility agreements from a direct family member of the CEO. As at September 30, 2018, the total amount owed under these facilities, including principal and accumulated interest is $22,944,220 (2017 – $19,959,621). As at September 30, 2018, the entire balance owed is due within 12 months and is therefore classified as current on the statement of financial position. During fiscal 2017, there was a debt settlement of which $14,723,107, which related to loans made by the CEO and the direct family member, as outlined in Note 11. The combined total of the above loans still outstanding, including the accrued interest, is $29,328,313 (2017 – $25,546,590) in current liabilities. These loans will be repaid by either GLG or its Chinese subsidiary to the lender in the currency the loans were originally borrowed (either USD or RMB), or, at the lender’s discretion, in the alternate currency, depending on the terms of the specific credit facility. The terms of each individual loan are disclosed in the table below. These loans provide a repayment option to the lenders in either RMB or USD using a fixed foreign exchange rate specified in each credit facility. This option results in a liability of $359,313 (2017 – $152,538), which is accounted as liabilities on derivatives and unrealized foreign exchange losses. The assumptions for the fair value determination of the liability are the same as those outlined in Note 8.

Category 1: US 10 year benchmark government bond rate plus 1100 basis points annual interest rate for loans issued in USD or China 10 year benchmark government bond rate plus 1100 basis points annual interest rate for loans issued in RMB, compounding quarterly
Category 2: 20% annual interest rate, compounding quarterly
Category 3: 18% annual interest rate, compounding quarterly
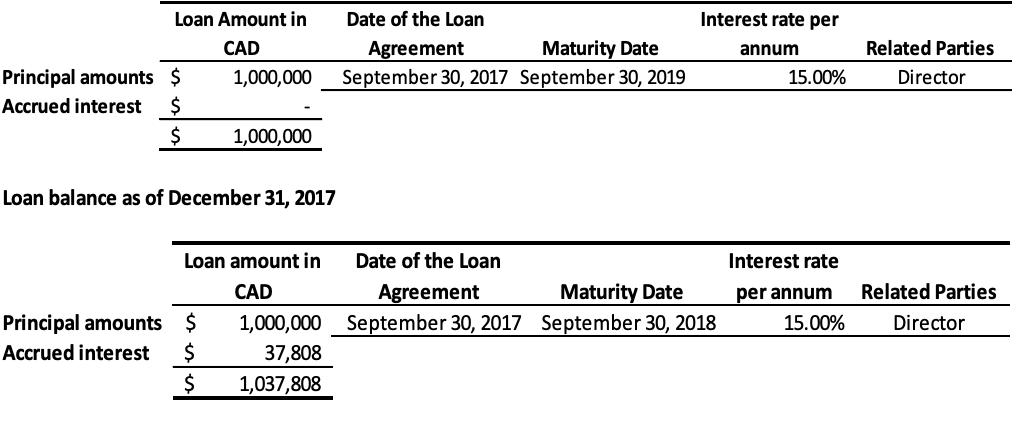
- As of September 30, 2018, the Company has a loan of $1,000,000 (2017 – $1,000,000) from a Director of the Company to provide working capital required for monk fruit extracts. The loan is secured by expected proceeds from monk fruit sales, bearing interest at 15% per annum and repayable in full within twenty-four months of the disbursement date. As of September 30, 2018, the total amount due to this related party including interest was $1,000,000 (2017 – $1,037,808) and is classified under current liabilitiesLoan balance as of September 30, 2018
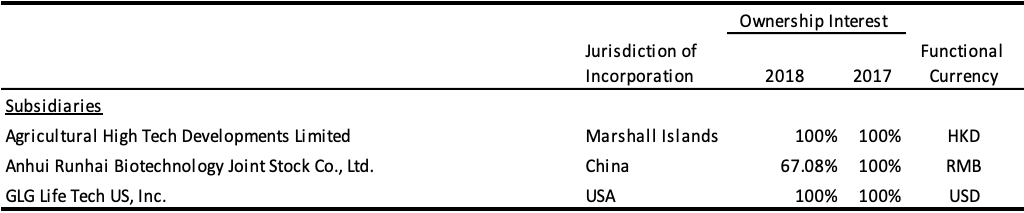
Subsidiaries
The followings are the subsidiaries of the Company:
Disclosure Controls and Internal Controls over Financial Reporting
The Company’s disclosure controls and procedures are designed to provide reasonable assurance that relevant information relating to the Company, including its consolidated subsidiaries, is made known to senior management in a timely manner so that information required to be disclosed by the Company under securities legislation is recorded, processed, summarized and reported within the time periods specified in applicable securities legislation. As of the end of the period covered by this report, the Company’s management evaluated, under the direction and supervision of the Chief Executive Officer and Chief Financial Officer, the effectiveness of the design and operation of the Company’s disclosure controls and procedures, as defined in National Instrument 52-109 Certification of Disclosure in Issuers’ Annual and Interim filings (“NI 52-109”). The Company’s Chief Executive Officer and Chief Financial Officer have concluded that as of September 30, 2018, the Company’s disclosure controls and procedures were effective to ensure that information required to be disclosed in reports the Company files or submits to the Canadian Securities Administrators (“CSA”) is recorded, processed, summarized and reported within the time periods specified therein and accumulated and reported to management to allow timely discussions regarding required disclosure.
The Company’s management, under the direction and supervision of the Chief Executive Officer and Chief Financial Officer, is also responsible for establishing and maintaining internal control over financial reporting. These controls are designed to provide reasonable assurance regarding the reliability of financial reporting and the preparation of financial statements for external purposes in accordance with accounting principles generally accepted in Canada.
Management assessed the effectiveness of the Company’s internal control over financial reporting, as defined in NI 52-109, as of September 30, 2018. In making this assessment, management used the criteria set forth in the “Internal Control – Integrated Framework” issued by the Committee of Sponsoring Organizations of the Treadway Commission. Based on this assessment, the Company’s Chief Executive Officer and Chief Financial Officer have concluded that as of September 30, 2018, the Company’s internal control over financial reporting were effective. It should be noted that while the officers of the Company have certified the Company’s period-end filings, they do not expect that the disclosure controls and procedures or internal controls over financial reporting will prevent all errors and fraud. A control system, no matter how well conceived or implemented, can only provide reasonable, not absolute, assurance that the objectives of the control system are met.
Risks Related to the Company’s Business
This section describes the material risks affecting the Company’s business, financial condition, operating results and prospects. A prospective investor should carefully consider the risk factors set out below and consult with his, her or its investment and professional advisors before making an investment decision. There may be other risks and uncertainties that are not known to the Company or that the Company currently believes are not material, but which also may have a material adverse effect on the Company’s business, financial condition, operating results or prospects. In that case, the trading price of the common shares could decline substantially, and investors may lose all or part of the value of the common shares held by them. There are a number of risk factors that could materially affect the business of GLG, which include but are not limited to the risk factors set out below. The Company has been structured to minimize these risks. More details about the following risk factors can be found in the Company’s Annual Information Form filed on SEDAR at www.sedar.com.
• Intellectual Property Infringement
• Product Liability Costs
• Manufacturing Risk
• Inventory Risk
• Customer Concentration Risk
• Competition
• Government Regulations
• Consumer Perception of Products
• Changing Consumer Preferences
• Market Acceptance
• Dependence on Key Personnel
• Volatility of Share Prices
Risks Associated with Doing Business in the People’s Republic of China
The Company faces the following additional risk factors that are unique to it doing business in China. More details about the following risk factors can be found in the Company’s Annual Information Form.
•Government Involvement
• Changes in the Laws and Regulations in the People’s Republic of China
• The Chinese Legal and Accounting System
• Currency Controls
• Additional Compliance Costs in the People’s Republic of China
• Difficulties Establishing Adequate Management, Legal and Financial Controls in the People’s Republic of China
• Capital Outflow Policies in the People’s Republic of China
• Jurisdictional and Enforcement Issues
• Political System in the People’s Republic of China
Additional Information
Additional information relating to the Company, including our Annual Information Form, is available on SEDAR (www.sedar.com). Additional information relating to the Company’s related party debt conversion transaction, as described in the Company’s Management Proxy Circular, is available on SEDAR (www.sedar.com). Additional information relating to the Company is also available on our website (www.glglifetech.com).
Leave a Reply